
ServiceNow 3D Node Map
Rethinking how people explore complex enterprise systems

Role: Senior Staff Product Designer
Team: Rohan Gaikwad, George Hinchliffe, David Russo
Award: 🏆 UX Design Awards Public Choice Winner 2023
Category: Concept
The Opportunity
Modern enterprises contain thousands of interconnected applications, services, databases, servers, and dependencies. While the data exists, understanding it is difficult. Traditional dependency maps become increasingly dense as systems grow, making it harder to identify relationships, uncover patterns, and assess downstream impact.
Our team explored a simple question:
“Could a spatial, interactive 3D environment make complex enterprise systems easier to understand than a traditional 2D map?”
The Vision
Node Map 3D was a design concept that transformed ServiceNow asset and relationship data into an interactive three-dimensional environment.
Rather than navigating a static diagram, users could move through a living network of connected assets—exploring relationships from multiple perspectives and uncovering patterns that are difficult to recognize in a flat view.
The concept combined ServiceNow IT asset data with open-source 3D visualization technologies to create a more exploratory and intuitive way to understand system complexity.
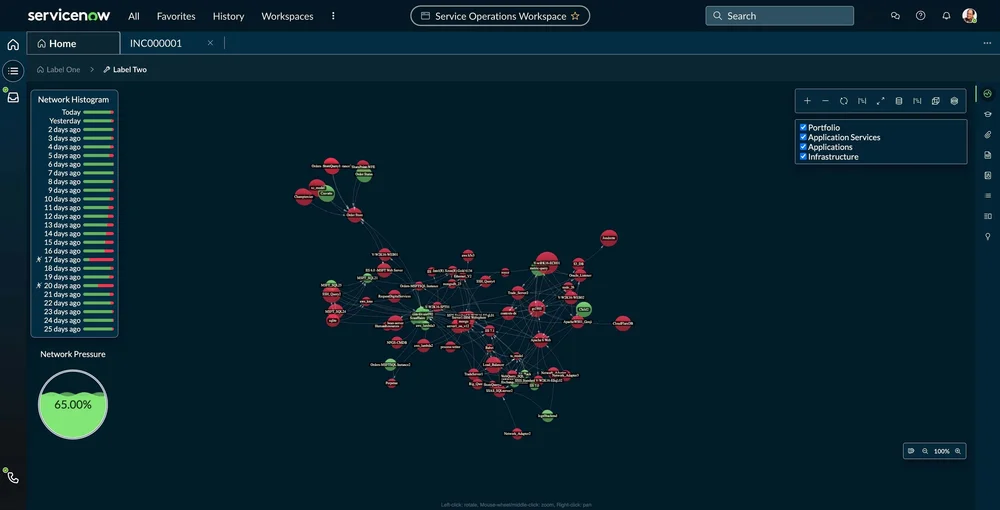
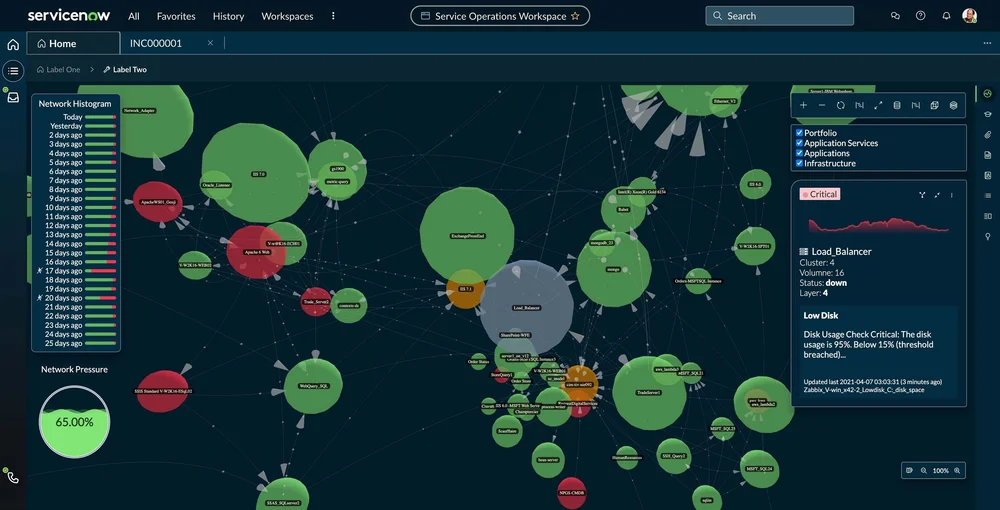
Investigate issues in context
Selecting any node surfaces live health data, alerts, and metrics instantly — without leaving the 3D environment or losing sight of the surrounding system.
Explore the system from any angle
Users rotate, pan, and zoom freely through the network, revealing spatial relationships between assets that a flat diagram would otherwise hide.
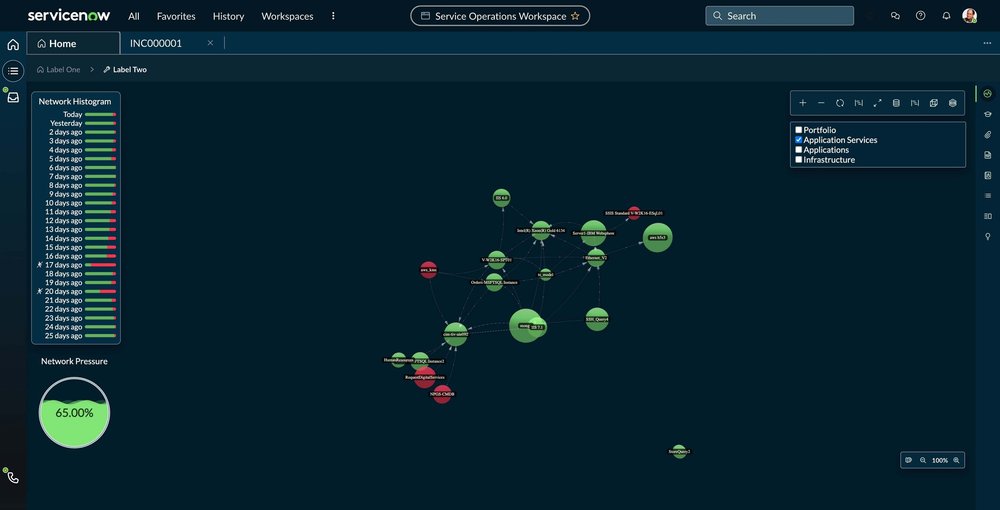
See impact ripple across the system
Color and clustering make downstream failure easy to trace — showing at a glance how one issue can cascade through dozens of connected services.
My Contribution
As part of the core design team, I helped shape the overall experience vision and interaction model.
My work focused on:
Experience strategy
Information architecture
Visualizing complex relationship data
Interaction design
Prototype direction
Storytelling and presentation
Cross-functional collaboration with design and engineering
The goal was not simply to create a compelling visualization. The goal was to help users make better decisions by making relationships easier to see and understand.
Key Design Challenges
1. Making Complexity Understandable
Enterprise systems are naturally interconnected. As relationship density increases, visualizations often become cluttered and difficult to navigate.
The challenge was finding ways to reveal complexity without overwhelming the user. We explored:
Cluster-based organization
Visual hierarchy
Progressive disclosure
Relationship highlighting
Focus-and-context navigation
2. Maintaining Orientation
Moving through a large network in three dimensions creates new usability challenges. Users need to understand where they are, what they are looking at, and how everything connects. The experience was designed to balance exploration with orientation, allowing users to investigate details while maintaining awareness of the larger system.
Outcome
The concept demonstrated an alternative approach to enterprise visualization by treating infrastructure as an explorable environment rather than a static diagram.
Users could:
Navigate large-scale asset networks
Discover relationship patterns visually
Analyze dependencies from multiple angles
Move between high-level and detailed views
Better understand how systems connect and influence one another
The project attracted strong internal interest and received external recognition from the international design community.
Recognition
UX Design Awards Public Choice Winner 2023
Node Map 3D – IT Asset Interactive Visualization
ServiceNow | Concept Category
Reflection
Node Map 3D reinforced a lesson that continues to influence my work today:
Many enterprise problems are not data problems. They are understanding problems.
When people can see relationships more clearly, they can make faster decisions, identify risks earlier, and develop a deeper understanding of complex systems. This project combined systems thinking, emerging visualization techniques, and enterprise UX to explore what the future of enterprise exploration could look like, resulting in an award-winning concept recognized beyond ServiceNow.